Methodology
k-core decomposition:
Our goal is to study changes in the structure of the AS-level Internet ecosystem from the perspective of content providers and CDNs, specifically whether large CPs are now part of the core of the network, and the historical evolution of when such a transition occurred. For this purpose, it is necessary to define a methodology to determine which ASes are part of the core of the network.
We refer to the core of the network as the subset of ASes that are densely connected. To compute the set of such ASes, we use k-core decomposition, a naturally applicable tool from the graph-theoretic literature. A k-core of a given graph G is the maximum induced subgraph in which all the vertices have at least degree k (see [1]).
In other words, a vertex or node that belongs to a k-core has at least k neighbors which all have degree at least k. Moreover, taking into account the definition of a k-core, a node that belongs to core k also belongs to any core j<k, thus the shell-index is given by the maximum core that a node belongs to.
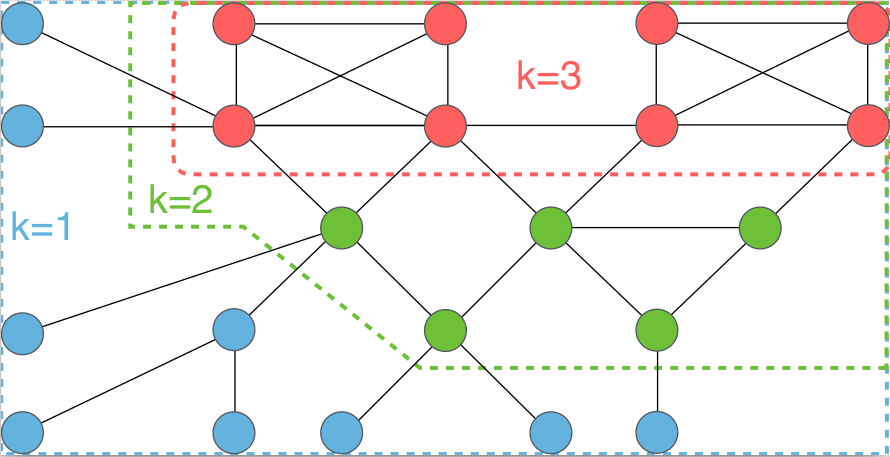
Figure 1 displays k-cores using a small graph example where nodes are colored to indicate their shell-index. As the figure shows, the shell-index (or simply "core") is basically given by the degree of the node as well as the degree of the neighbors in the induced graph. This can be seen on the figure where some four-degree nodes are in core 2 while nodes of degree 3 are in core 3. Furthermore, AS graphs are core-connected[2], which means that there are k different paths between two ASes of the same k-core.
The central part of the network is made of ASes that belong to the maximum core kmax. In our analysis we study the evolution of cores of the CPs. However, the kmax as well as the k-indices of the AS graph change over time. For this reason, we normalize k in each snapshot by its kmax index, which leads to a normalized k, which we refer to as k*, with values between 0 and 1.
For now on, TOPcore will refer to k*=1.
To calculate k-core decomposition on each snapshot of an AS graph we used two tools, LaNet-vi[2], which also provides network visualization, and NetworkX, a python library.
AS graph datasets:
To apply the above k-core decomposition methodology on the Internet graph longitudinally, we need periodic historical snapshots of the Internet's AS-level topology.
We rely on publicly available AS topology snapshots from CAIDA. CAIDA curates AS topology data from both BGP and traceroute-derived sources.
The BGP AS relationship dataset (named serial-1) is derived from BGP dumps taken from RouteViews and RIPE RIS collectors[3] from 1998 to present, and contains each AS link observed at the BGP collectors along with an inferred business relationship for the link. We use a second dataset which consists of AS links extracted from traceroutes from CAIDA's Archipelag[4] vantage points towards every routed /24 prefix1.
The two datasets can provide somewhat different views of the Internet's AS-level topology.
As our goal is to study the connectivity of CPs, we need a dataset that provides the most complete picture of AS-level connectivity, while at the same time providing historical snaphots. For this purpose, we chose to combine data from both the BGP and Ark datasets, which we refer to as the "Ark+BGP" dataset. This dataset consists of monthly snapshots dating from 1998 to the present time, which is sufficiently long to detect the evolution of the number of peers of CPs.
Note that both the Ark platform as well as Routeviews and RIPE RIS BGP collectors have been incorporating new vantage points over time, and hence early snapshots could be slightly underrepresented as compared to later snapshots.
1
The Ark dataset was merged with skitter dataset http://data.caida.org/datasets/topology/skitter-aslinks/..
References
[1] V. Batagelj and M. Zaveršnik,"Fast algorithms for determining (generalized) core groups in social networs", Advances in Data Analysis and Classification, vol. 5, no. 2, pp. 129-145, 2011.
[2] M. G. Beiró, J. I. Alvarez-Hamelin, and J. R. Busch,"A low complexity visualization tool that helps to perform complex systems analysis", New J. Phys, vol. 10, no. 12, p. 125003, 2008.
[3] M. Luckie, B. Huffaker, A. Dhamdhere, V. Giotsas, and k. claffy, "As relationships, customer cones, and validation", in Proceedings of ACM IMC. ACM, 2013.
[4] CAIDA, "Archipelago (Ark) Measurement Infrastructure", https://www.caida.org/projects/ark/